AG — Prof. Heiko Rieger — Statistical Physics
Superfluid clusters, percolation and phase transitions in the disordered, two dimensional Bose-Hubbard model
Introduction
The Bose-Hubbard model describes ultracold bosons in optical lattices. At zero temperature it shows a quantum phase transition from an incompressible Mott insulating phase to a superfluid phase, well described by both quantum Monte Carlo and mean field methods. In the presence of diagonal disorder the compressible Bose glass phase appears in between and quantum Monte Carlo and widely used mean field predictions differ gravely. We study this disordered system in local mean field approximation. The introduction of the superfluid parameter ψi = ⟨âi⟩ the full quantum problem can be transformed into a set of individual quantum sites with mean field coupling. On the basis of averaged order parameters like the mean superfluid parameter or the compressibility this method yields a phase diagram, which shows severe deviations from quantum Monte Carlo results. However, we were able to show that local mean field calculations can actually reproduce quantum Monte Carlo phase transitions 1.
Characteristics of the Bose glass phase
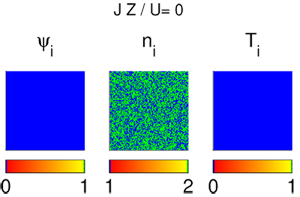
We advocate the picture of the Bose glass phase being the Griffiths region of the disordered Bose-Hubbard model. It is characterized by what we call superfluid clusters having non-integer local boson occupation numbers within a Mott insulating background. The movie shows the growth of superfluid clusters and their final percolation.

Figure 1: Configurations of the local SF parameter ψi (left) followed by the
occupation number ⟨ i⟩ and the discrete variable Ti (superfluid sites Ti = 1 in
green and Mott insulating sites Ti = 1 in blue) for Δ∕U = 0.6. With increasing
tunneling strength JZ∕U superfluid sites occur and grow in number and size
until they finally percolate.
Phase diagram
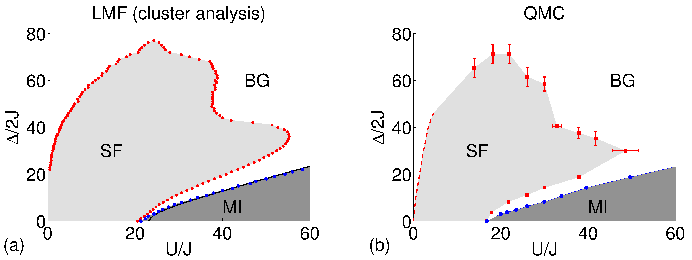
We propose to utilize this characterization to identify the zero-temperature phase diagram: While in the Mott insulator phase only integer occupation numbers occur, the appearance of superfluid clusters indicates the transition to the Bose glass phase. In the superfluid phase these clusters finally percolate. Additionally to a deeper understanding of the Bose glass phase, this new criterion for the different phases leads to phase transitions which reproduce quantum Monte Carlo results with surprising accuracy. Moreover, modern experimental techniques feature single site resolution, such that direct observation of the growth of superfluid clusters and their percolation is accessible.

Figure 2: Left: Local mean field cluster analysis phase diagram for commensurate boson density n = 1. The percolation transition of the superfluid sites (Ti = 1) occurs crossing the red line, which indicates the Bose glass-superfluid phase boundary. The blue line marks the boundary of the MI region, in which all sites are MI sites (Ti = 0). Right: Prediction for the phase diagram for commensurate boson density n = 1 based on the results of QMC simulations [Phys. Rev. Lett. 107, 185301 (2001)].
Future investigations
The established picture of superfluid clusters sheds light on the local characteristics of the Bose glass phase and allows for the determination of the phase diagram on this basis. On-site disorder drawn from a box distribution was widely studied in the past, even though real experimental setups naturally include disordered tunneling strength or inter-particle interaction drawn from a variety of distributions. We will take a closer look on disorder realizations which follow the experimental setup more closely and study the resulting distributions in all three Bose-Hubbard parameters.
References
| Superfluid clusters, percolation and phase transitions in the disordered, two dimensional Bose-Hubbard model |
|
| New J. Physics 15, 075029 (2013) | [cond-mat], [pdf] |
Legal notice (Impressum) Privacy policy


